Genome evolution tutorial
This section will cover a set of tools implemented in the PLAZA platform that can be used to study genome evolution. Especially in plants WGDs occurred independently in several lineages.
This tutorial will show how to use WGDotplot, Skyline plot & Multiplicon view
Detection of genomic homology (basic)
Evidence for two WGDs in Arabidopsis thaliana
Here is explained how, using the Vitis (or papaya) genome, the existence of two Arabidopsis specific WGDs can be demonstrated.
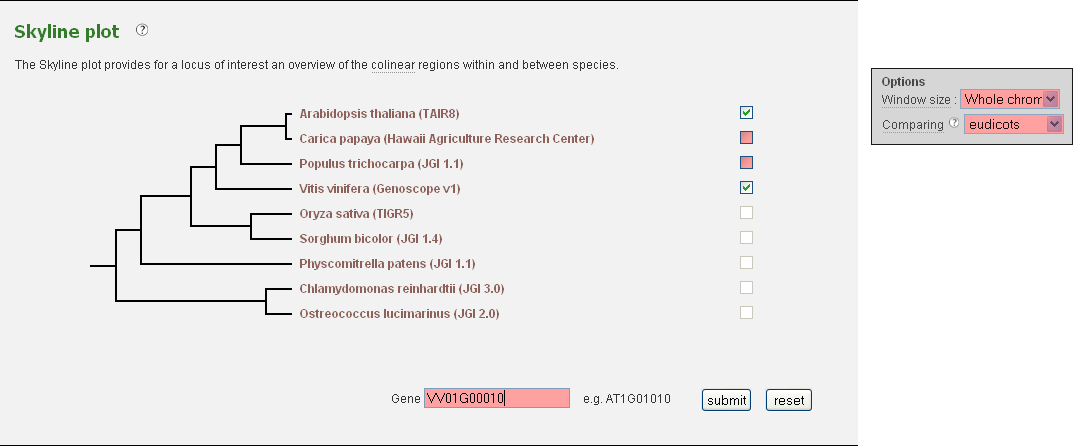
- In the menu select Analyze→Skyline plot
- Set Window size to Whole chromosome & Comparing to eudicots in the Options box on the right. It is highly recommended to select in Comparing the smallest set of organisms that has all the species you'd like to compare. Additional species can have a negative influence on the higher level multiplicons i-ADHoRe detects.
- Now Deselect Populus trichocarpa & Carica papaya in the species tree
- Use gene VV01G00010 as a reference gene by filling in the gene ID in the textbox on the bottom (this gene is used to select the reference region that is shown in the plot. This is required. In case you're interested in an entire chromosome just pick a random gene on that chromosome)
- Click submit and wait for the plot to appear
- Optionally you can repeat this process for genes on other chromosomes

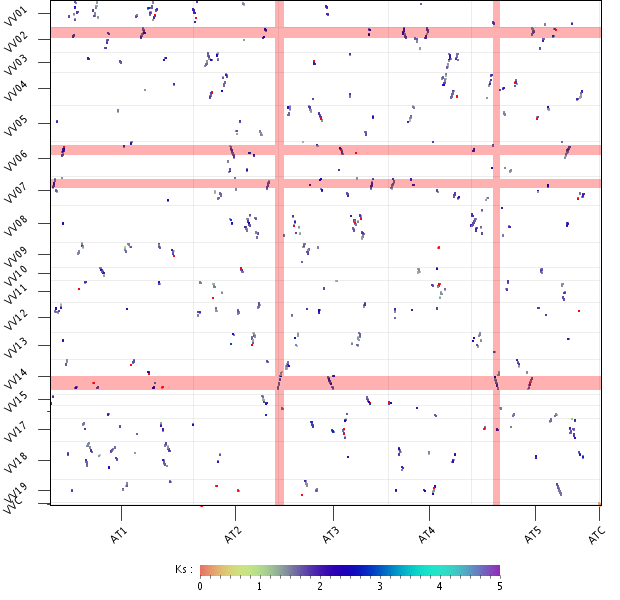
- In the generated Skyline plot a couple 1:4 and 1:3 Vitis:Arabidopsis regions can be observed and with a few exceptions the number of Arabidopsis segments > the number of Vitis segments
- Though the skyline plot is a great tool to find homologous segments, it can be seen that in this case results aren't conclusive

- A second tool to study genomic homology, the WGDotplot, can in this case be used for further analysis.
- In the menu select Analyze→WGDotplot
- First set Comparing to eudicots
- Set Organism 1 to Arabidopsis thaliana and Organism 2 to Vitis vinifera
- Click submit and wait while the WGDotplot is generated
- Now take a good look at the plot and notice:
- For several Vitis regions there are up to 4 colinear Arabidopsis regions
- An Arabidopsis region is only colinear with one Vitis region
- Here more examples of the 1:4 Vitis:Arabidopsis relation can be found
- On the image several regions from Vitis that match 4 Arabidopsis regions have been highlighted.
Additional Exercise: WGDs in Populus trichocarpa
- How many duplications can be found in Populus trichocarpa using this appoach?
- Additional tips:
- There is a triplication(hexaploidisation) shared between all eudicots
- Poplar and grapevine have slowly evolving genomes and remnants of this event are still visible in the inter-species WGDotplot
- The color coding by Ks can sometimes help discriminating old events from recent ones.
- If you figured out this one you are ready for the advanced tutorial!
- View the Solution
Timing of WGDs in plants (advanced)
This part of the tutorial will go more into depth on how Ks and genomic homology can be used to pinpoint WGDs in different lineages. Please note that this is an advanced tutorial and you should be familiar with Ks dating, genomic homology and have a basic knowledge of the phylogeny of the species (hint: a species tree can be found on PLAZA's main page). Please ensure you're familiar with the tools in PLAZA, there is a more elaborate tutorial on the tools used here.
WGD in monocots: Rice & Sorghum
The goal here is to determine if the most recent WGD in Rice and Sorghum is a shared event.
- Start with generating an Rice-Rice WGDotplot. You can do this from the menu Analyze → WGDotplot , select Rice (Oryza sativa) for both organism 1 and 2. Leave other settings at their default values. Now click submit to generate the plot. Now look at the plot carefully, note that the remnants of a WGD can be seen with a Ks of ~1.
- Do the same thing for Sorghum, again remnants of a rather recent WGD can be seen with again a Ks of ~1
- Finally generate using the WGDotplot a Rice-Sorghum plot. (select Rice as organism 1 and Sorghum as organism 2 or vica versa) Now a set of long preserved colinear regions can be seen with a Ks of ~0.5 together with a set of older ones. The lowest Ks (most recent) values in an inter-species comparison will always be due to the speciation event.
- Combining the knowledge from the three plots we conclude that both Sorghum and Rice have remnants of one recent (and small hints of an older event). As the Ks for this event is in both cases higher then the speciation, we can conclude the WGD predates the speciation and therefore is an event shared by both species.
WGD in rosids: Poplar & Arabidopsis
- Repeat this exercise with Poplar (Populus trichocarpa) and Arabidopsis thaliana. The intra species plots reveal a WGD in Arabidopsis with a Ks ~1 and one in Poplar with a Ks ~0.2. Though there is a big difference in Ks it's still too early to conclude these were two separate events. A difference in nucleotide substitution rate can cause this difference in Ks as well. Though the inter-species plot reveals the speciation has a Ks of >1.5. With this new evidence we can now reliably certainty conclude that the duplications are in fact independent of each other.
- Note that here there are also hints of older duplications.
Additional exercises: Uncovering the paleo-hexaploidization in eudicots
- The same thing can be repeated using the Vitis and papaya genome. Though this case is much less obvious compared to the previous examples.
- View our Solution