
TF2Network covers 1793 Position Weight Matrices (PWMs) for 916 Transcription Factors (TFs). For each PWM, the top 5000 genes that contain the PWM in their non-coding region is stored.
TF2Network uses hypergeometric tests to score the occurrence of each PWM within a given set of genes. Through these tests, PWMs are assigned a p-value, corrected for multiple testing with the Benjamini-Hochberg method. PWMs are then ranked on these p-values and TFs are sorted based on their best ranked PWM. TF2Network reports predicted regulators and allows the exploration of the resulting Gene Regulatory Networks through an interactive visualization.
| Interaction type | Published studies |
|---|---|
| Protein-DNA | Heyndrickx et al., 2014, O'Malley et al., 2016, Nagel at al., 2015, Verkest et al., 2014, Merelo et al., 2013, Liu et al., 2015, Song et al., 2016, Brady et al., 2011, De Lucas et al., 2016, Shani et al., 2017, Sparks et al., 2016, Taylor-Teeples et al., 2015, Tian et al., 2014, De Clercq et al., 2013 |
| Protein-Protein | Van Bel et al., 2012, Yazaki et al., 2016 |
| Co-expression | Klepikova et al., 2017 |
Comparative Network Biology (CNB) website: bioinformatics.psb.ugent.be/cnb/
This project was funded by the Flemish agency for Innovation by Science and Technology (IWT), the Fund for Scientific Research (FWO), and the Flemish Institute for Biotechnology (VIB).
Kulkarni S.R., Vaneechoutte D., Van de Velde J., Vandepoele K. (2017) TF2Network: predicting transcription factor regulators and gene regulatory networks in Arabidopsis using publicly available binding site information.
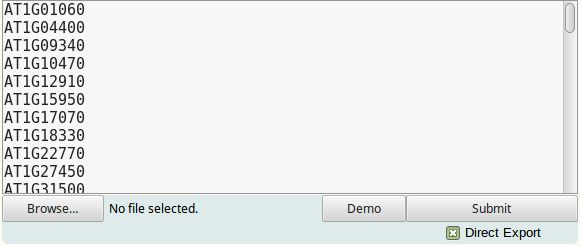
To submit a single gene set, gene names or identifiers should be provided to TF2Network in a vertical list. No spaces or tabs are allowed within the gene names:
Multiple gene sets can be submitted at once, but only if the 'Direct export' option is enabled. To do this, provide a two-column format where set names are in the first and gene names are in the second column. Columns can be separated by spaces or tabs. Set or gene names should not start with '[' or '('. Genes for which no set name is provided will be placed in an unnamed set:

By default, TF2Network will present your results in a Network Tool Interface where you can explore your gene set and their predicted regulators further. From the interface you can export the predictions in a tab-separated file. If you wish to skip the interface and export predictions directly, you can enable the 'Direct Export' checkbox below the Submit button. With the 'Direct Export' option enabled, TF2Network also allows the submission of multiple gene sets at once. Predictions will be generated for each gene set separately and returned in a single tab-separated file.

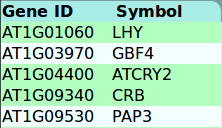
The Regulator Panel displays all predicted TFs and their PWMs that were found in the input gene set. PWMs are ranked on p-values and TFs are sorted based on their best ranking PWM. For each regulator, the first three columns show the gene identifier, the gene symbol, the co-expression score (CO), and the Protein-DNA score (PD).
The co-expression score indicates the percentage of input genes with which the predicted regulator coexpresses. The Protein-DNA score indicates with what percentage of the input genes the predicted regulator has an experimentla Protein-DNA interaction. Regulators for which no experimental data is available are shown with 'na' as their Protein-DNA score. Clicking the headers of either scores sorts the table on these values.
For each PWM, the identifier, rank, q-value, and the number of genes in the input set that contain the PWM are shown. Clicking the q-value column header sorts the predicted regulators on this value.Selecting PWMs will starts a network visualization for the corresponding TFs and the input genes with the PWMs. Clicking a Regulator selects all its PWMs. Multiple TFs can be selected simultaneously. Clicking the 'Export predictions' button below the table downloads a tab-separated file with the predictions. Clicking the GenomeView logo below a regulator's id starts a genomeview session that shows all PWM mappings for this regulator on the Arabidopsis thaliana genome.

The network visualization shows genes as nodes and interactions as edges. Known TFs are shown as blue diamonds, other genes are shown as green circles.
The positions of the genes reflects the number of selected TFs they are predicted to be targeted by. Genes that contain selected PWMs for all active TFs are placed centrally in a compact circle. The remaining genes with PWMs for more than one active regulator are then placed in concentric circles around the center so that genes with more TFs are closer to the center. Next, the active TFs are spaced out evenly outside these concentric circles. Finally, genes with selected PWMs for only one of the active TFs are placed in a compact circle near the TF, distal to the center.
Scrolling or dragging the mouse zooms or pans the view. Clicking a gene selects it. Multiple genes can be selected by holding the SHIFT key while clicking or dragging the mouse.

When and how each type of interaction is displayed can be changed in the Edge Manipulation panel. Edges for each type of interaction can be adjusted with sliders and buttons. Dragging the small slider or clicking the label next to it toggles between three display modes:
 Disabled: All edges are hidden
 Select-only: Only edges between selected genes are shown
 All edges: All edges are shown
The button next to it can be clicked to enable or disable the display of edges when hovering the mouse over a gene:
 Disabled: No edges shown on mouse-over
 Enabled: All edges of this type will be shown on mouse-over
The large slider on the bottom changes the edge thickness. For Co-expression interactions, it also sets a threshold to filters low correlation edges.
 PWM Mapping
Grey dashed arrow indicate PWM mappings between regulators selected in the Regulator Panel and genes that contain a PWM for this regulator. Only edges for PWMs selected in the Regulator Panel are shown.
 Protein-DNA
Solid black arrows indicate experimental Protein-DNA interactions. These were obtained from ChIP-Seq or Y1H experiments.
 Co-expression
Red lines indicate Co-expression interactions between genes. These edges were obtained by first processing a public RNA-Seq dataset by Kelpikova et al., 2017. For each gene, Pearson's correlation coefficients were calculated between its expression profile and the profiles of all other genes in the compendium. After converting the correlation coefficients to z-scores, only edges were kept with a z-score higher than 3 or lower than -3 (anticorrelated edges).
 Protein-Protein
Blue lines indicate Protein-Protein interactions between genes. These edges were obtained from CORNET3 and Yazaki et al., 2016.
Genes can be stored in gene sets to run Gene Ontology enrichments or to export interaction data.
Three gene sets are already available when the tool is loaded:
input_genes: Contains all genes provided by the user
predicted_TFs: Contains all the regulators predicted by TF2Network
all_genes: Contains all genes provided by the user plus the predicted regulators
Currently selected genes are shown in the gene list table. Genes in green are currently displayed in Cytoscape. Hovering or clicking genes in this list highlights or selects them.
 For a single gene: Shows GO annotations for this gene.
For a saved gene set: Shows GO enrichments in this gene set. Hovering the mouse over a GO term highlights the associated genes, clicking it selects them.
For a single gene: Shows GO annotations for this gene.
For a saved gene set: Shows GO enrichments in this gene set. Hovering the mouse over a GO term highlights the associated genes, clicking it selects them.
 For a single gene: Shows a table with all Protein-DNA interactions for this gene. Clicking the table header selects all connected genes.
For a saved gene set: Provides a button to download all Protein-DNA interactions between genes in this set and a button to untangle the Cytoscape network.
For a single gene: Shows a table with all Protein-DNA interactions for this gene. Clicking the table header selects all connected genes.
For a saved gene set: Provides a button to download all Protein-DNA interactions between genes in this set and a button to untangle the Cytoscape network.
 For a single gene: Shows a table with all Protein-Protein interactions for this gene. Clicking the table header selects all connected genes.
For a saved gene set: Provides a button to download all Protein-Protein interactions between genes in this set and a button to untangle the Cytoscape network.
For a single gene: Shows a table with all Protein-Protein interactions for this gene. Clicking the table header selects all connected genes.
For a saved gene set: Provides a button to download all Protein-Protein interactions between genes in this set and a button to untangle the Cytoscape network.
 For a single gene: Shows a table with all Co-expression interactions for this gene. Clicking the table header selects all connected genes.
For a saved gene set: Provides a button to download all Co-expression interactions between genes in this set and a button to untangle the Cytoscape network.
For a single gene: Shows a table with all Co-expression interactions for this gene. Clicking the table header selects all connected genes.
For a saved gene set: Provides a button to download all Co-expression interactions between genes in this set and a button to untangle the Cytoscape network.
 For a single gene: Shows the gene structure and the mapped locations of active PWMs on the gene's introns and its 5kb upstream and 1kb downstream regions.