Data Content
Primary gene annotation
Genome annotation of several plant species was collected and parsed into a uniform format.
An extensive overview of different gene types and data sources is shown in the PLAZA Data Overview.
Gene annotations can be compared between PLAZA version using the Gene Identifier Conversion tool.
Gene families
Based on sequence similarity inferred through BLAST, all protein-coding genes are stored in gene families using a graph-based clustering method (Markov clustering implemented in Tribe-MCL). We applied a post-processing procedure by tagging genes as outliers if they show sequence similarity to only a minority of all family members.
Complementary, the OrthoMCL 1.4 method was applied to infer sub-families based on the same protein similarity graph. Only sub-families delineated by OrthoMCL are retained if they overlap for 95% or more with a single gene family and if two or more sub-families can be found for a given gene family defined by the Markov clustering. Consequently, OrthoMCL clusters that are identical to Tribe-MCL clusters are discarded since they represent redundant information.
Complementary, the OrthoMCL 1.4 method was applied to infer sub-families based on the same protein similarity graph. Only sub-families delineated by OrthoMCL are retained if they overlap for 95% or more with a single gene family and if two or more sub-families can be found for a given gene family defined by the Markov clustering. Consequently, OrthoMCL clusters that are identical to Tribe-MCL clusters are discarded since they represent redundant information. Note that for the Integrative Orthology Viewer all OrthoMCL sub-families are considered to increase gene coverage across species.
Complementary, the OrthoMCL 2.0 method was applied to infer sub-families based on the same protein similarity graph. Only sub-families delineated by OrthoMCL are retained if they overlap for 95% or more with a single gene family and if two or more sub-families can be found for a given gene family defined by the Markov clustering. Consequently, OrthoMCL clusters that are identical to Tribe-MCL clusters are discarded since they represent redundant information. Note that for the Integrative Orthology Viewer all OrthoMCL sub-families are considered to increase gene coverage across species.
Complementary, the OrthoFinder method was applied to infer sub-families based on the same protein similarity graph. Only sub-families delineated by OrthoFinder are retained if they overlap for 95% or more with a single gene family and if two or more sub-families can be found for a given gene family defined by the Markov clustering. Consequently, OrthoFinder clusters that are identical to Tribe-MCL clusters are discarded since they represent redundant information. Note that for the Integrative Orthology Viewer all OrthoFinder sub-families are considered to increase gene coverage across species.
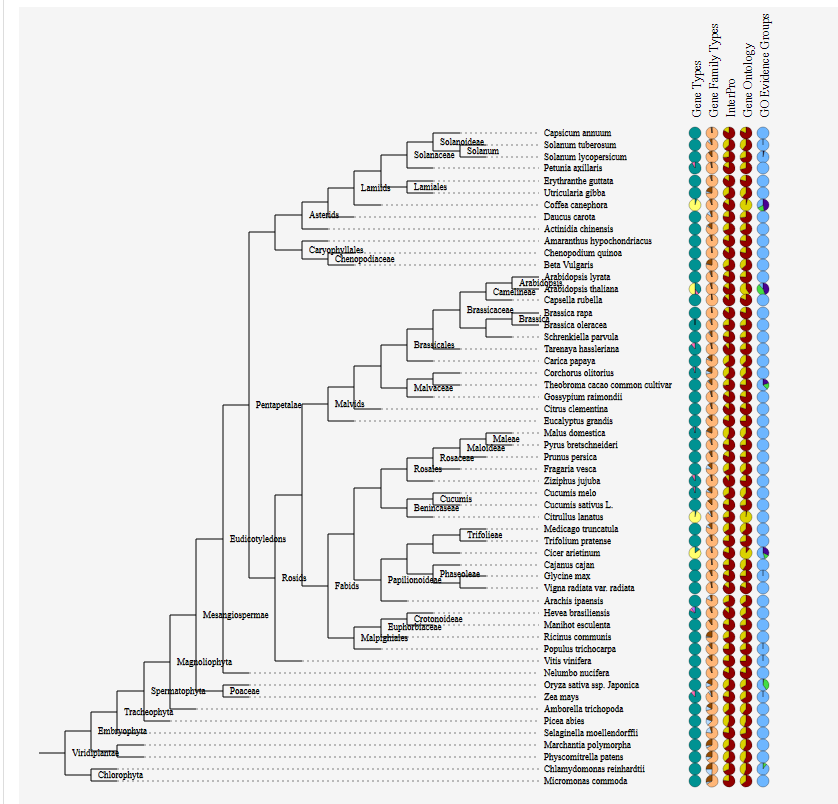
Apart from the phylogenetic profile, which indicates the presence or absence of a gene family in a set of species, for each family a set of keywords are reported based on the GO and/or InterPro functional information of the genes within a family (if available). Gene Ontology data for a gene family is gathered by using the GO enrichment procedure, followed by a sanity check which ensures that enriched GO terms are associated with at least 50% of the genes of the gene family. InterPro information is assigned to a family based on associations that cover at least 50% of the genes of the gene family.
Functional annotation
Gene Ontology terms
Gene Ontology (GO) terms are labels which belong to a controlled vocabulary to describe gene and gene product attributes in any organism. All GO labels are structured in a directed graph, where parent-child relationships indicate inheritance of attributes. When a gene is annotated with a certain GO term it comes with an evidence tag. These evidence tags indicate what kind of evidence supports the functional annotation of the gene with that particular GO term. Apart from the primary GO annotations we also provide a set of projected GO annotations which are inferred using sequence orthology.
For more information: http://www.geneontology.org/
InterPro domains
InterPro is a database of protein families, domains and functional sites in which identifiable features found in known proteins can be applied to new protein sequences.
For more information : http://www.ebi.ac.uk/interpro/
SignalP
SignalP predicts the presence and location of signal peptide cleavage sites in amino acid sequences from different organisms.
For more information : http://www.cbs.dtu.dk/services/SignalP/
MapMan
An alternative ontology designed specifically with Plants in mind, in Plaza 4.0 MapMan terms are also reported along with GeneOntology annotations.
The MapMan ontologyversion used in PLAZA 4.0 is MapMan 4, and the results are computed using Mercator 4.
For more information: https://plabipd.de/portal/mapman
MapMan
An alternative ontology designed specifically with Plants in mind, in Plaza 3.0 MapMan terms are also reported along with GeneOntology annotations.
The MapMan ontology version used in PLAZA 3.0 is MapMan 3.
For more information : http://mapman.gabipd.org/
PlantTFDB and PlnTFDB
PlantTFDB and PlnTFDB contain detailed classifications for transcription factors, as of PLAZA 3.0 links to these two platforms are included.
For more information : http://planttfdb.cbi.pku.edu.cn/ (PlantTFDB) and http://plntfdb.bio.uni-potsdam.de/v3.0/ (PlnTFDB)
External Sources (PlantTFDB, PlnTFDB, TAPscan)
Starting from PLAZA 4.0 several hooks are create that allow the PLAZA website to link to external sources for gene annotations, such as PlantTFDB, PlnTFDB, TAPscan. If available, the information from these external sources are displayed at the bottom of a gene page, within the same view as the other functional annotations. Examples include PlantTFDB, PlnTFDB and TAPscan, which contain detailed classifications for transcription factors.
For more information : http://planttfdb.cbi.pku.edu.cn/ (PlantTFDB), http://plntfdb.bio.uni-potsdam.de/v3.0/ (PlnTFDB), and https://plantcode.online.uni-marburg.de/tapscan/ (TAPscan)
Reactome data

Reactome data consists of biochemical processes, called pathways. These pathways consist of molecular events (reactions) mediated by one or more genes. Pathways can consist of sub-pathways, and genes are associated with both a reaction and the pathway which contains this reaction (see figure). The reactome information for the Arabidopsis thaliana genome was obtained and parsed, and from these the orthologous biochemical pathways in other species are subsequently derived. This data is only present in PLAZA 1.0.
For more information : http://www.arabidopsisreactome.org/
AnnoMine
Since gene descriptions were lacking for many algal species in the pico-PLAZA database, we designed a novel homology-based text-mining approach (AnnoMine) to functionally annotate genes, complementary to the well-structured InterPro and GO annotations. Briefly, for each query gene a BLASTP search was performed against the NCBI non-redundant protein database and all gene descriptions together with their corresponding E-value were used to derive a consensus gene description. All hits per gene were weighted according to reported E-values and subsequently pooled together to identify, based on the different gene descriptions, subsequent words (‘tokens’) that are statistically overrepresented, compared to a background model of >250,000 randomly sampled gene descriptions. As a result, n consequent tokens (n-grams) are reported that represent a consensus functional annotation based on homologs of the unknown gene.
Colinearity information
Overview
Colinearity information, representing genomic homology based on conserved gene content and order, was generated using i-ADHoRe 2.4. Colinearity information is used to study two types of events: duplication events (tandem, segmental or whole genome duplications) and speciation events. This information is used in various visualizations to study Genome evolution using the PLAZA platform: WGDotplot, and Skyline Plot.
Colinearity information, representing genomic homology based on conserved gene content and order, was generated using i-ADHoRe 3.0. Colinearity information is used to study two types of events: duplication events (tandem, segmental or whole genome duplications) and speciation events. This information is used in various visualizations to study Genome evolution using the PLAZA platform: WGDotplot, Skyline Plot, Multiplicon View, and Circle Plot.
Duplication event information
Chromosomal rearrangements are a common occurrence after large-scale duplication events, while hindering the correct detection of such events. Regions within a genome containing the same gene content and order indicate a shared origin between these segments. Grouping these segments together into multiplicons allows the PLAZA platform to infer whether homologous genes are the result of a large-scale duplication events (block duplicates). Duplication events are often studied to understand the origins of neo- and subfunctionalization of genes.
Tandem duplication events refer to local duplication events creating neighboring homologous genes. i-ADHoRe is also used to identify tandemly duplicated genes and uses the concept of a tandem representative to represent a tandem cluster (e.g. A1 is the representative of tandem cluster A1, A2 and A3). Consequently, when 'Viewing all colinear gene pairs' on a Gene page, all colinear gene pairs between B1 and A1 will be extended to also include B1-A2 and B1-A3.
Speciation event information
After a speciation event chromosomal rearrangements, specific for each new species, start accumulating. Genomic segments in different species which contain conserved gene content and order can as such be studied to infer how the genome structure evolved in various species (eg. chromosome fusions/fission can be detected, inversion, translocations, etc.).
Segments and multiplicons
Note that apart from pairwise comparisons between chromosomes (denoted level 2 multiplicon) the profile search generates multiplicons that contain multiple homologous genomic segments (from one or more species).
Orthologous genes
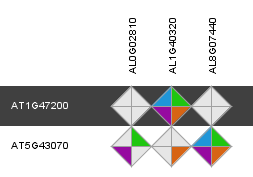

Through the integration of a complementary set of data types and methodologies orthologous gene relationships are inferred. The rationale of combining multiple approaches is to generate a consensus view of gene orthology between different species. Selecting the 'Details' diamond starts a view displaying the results of the different information sources. Approaches in the Integrative Orthology Viewer include:
- Orthologous gene families (ORTHO) (i.e. sub-families)
- Tree-based orthologs (TROG) inferred using tree reconciliation of the phylogenetic tree of a gene family
- Best-Hits-and-Inparalogs (BHIF) inferred from Blast hits against the PLAZA protein database. Selects per target species the best Blast hit including inparalogs (i.e. genes from the same species having higher bit scores that the best hit from any other species).
- Anchor points refer to gene-based colinearity between species. Provides info about putative positional orthologs.
Clicking on an individual diamond reports the detailed information per gene pair and links to the different data source that were used (i.e. sub-family, gene family phylogenetic tree, PLAZA Blast hits and Multiplicon info).