Construction
Workflow
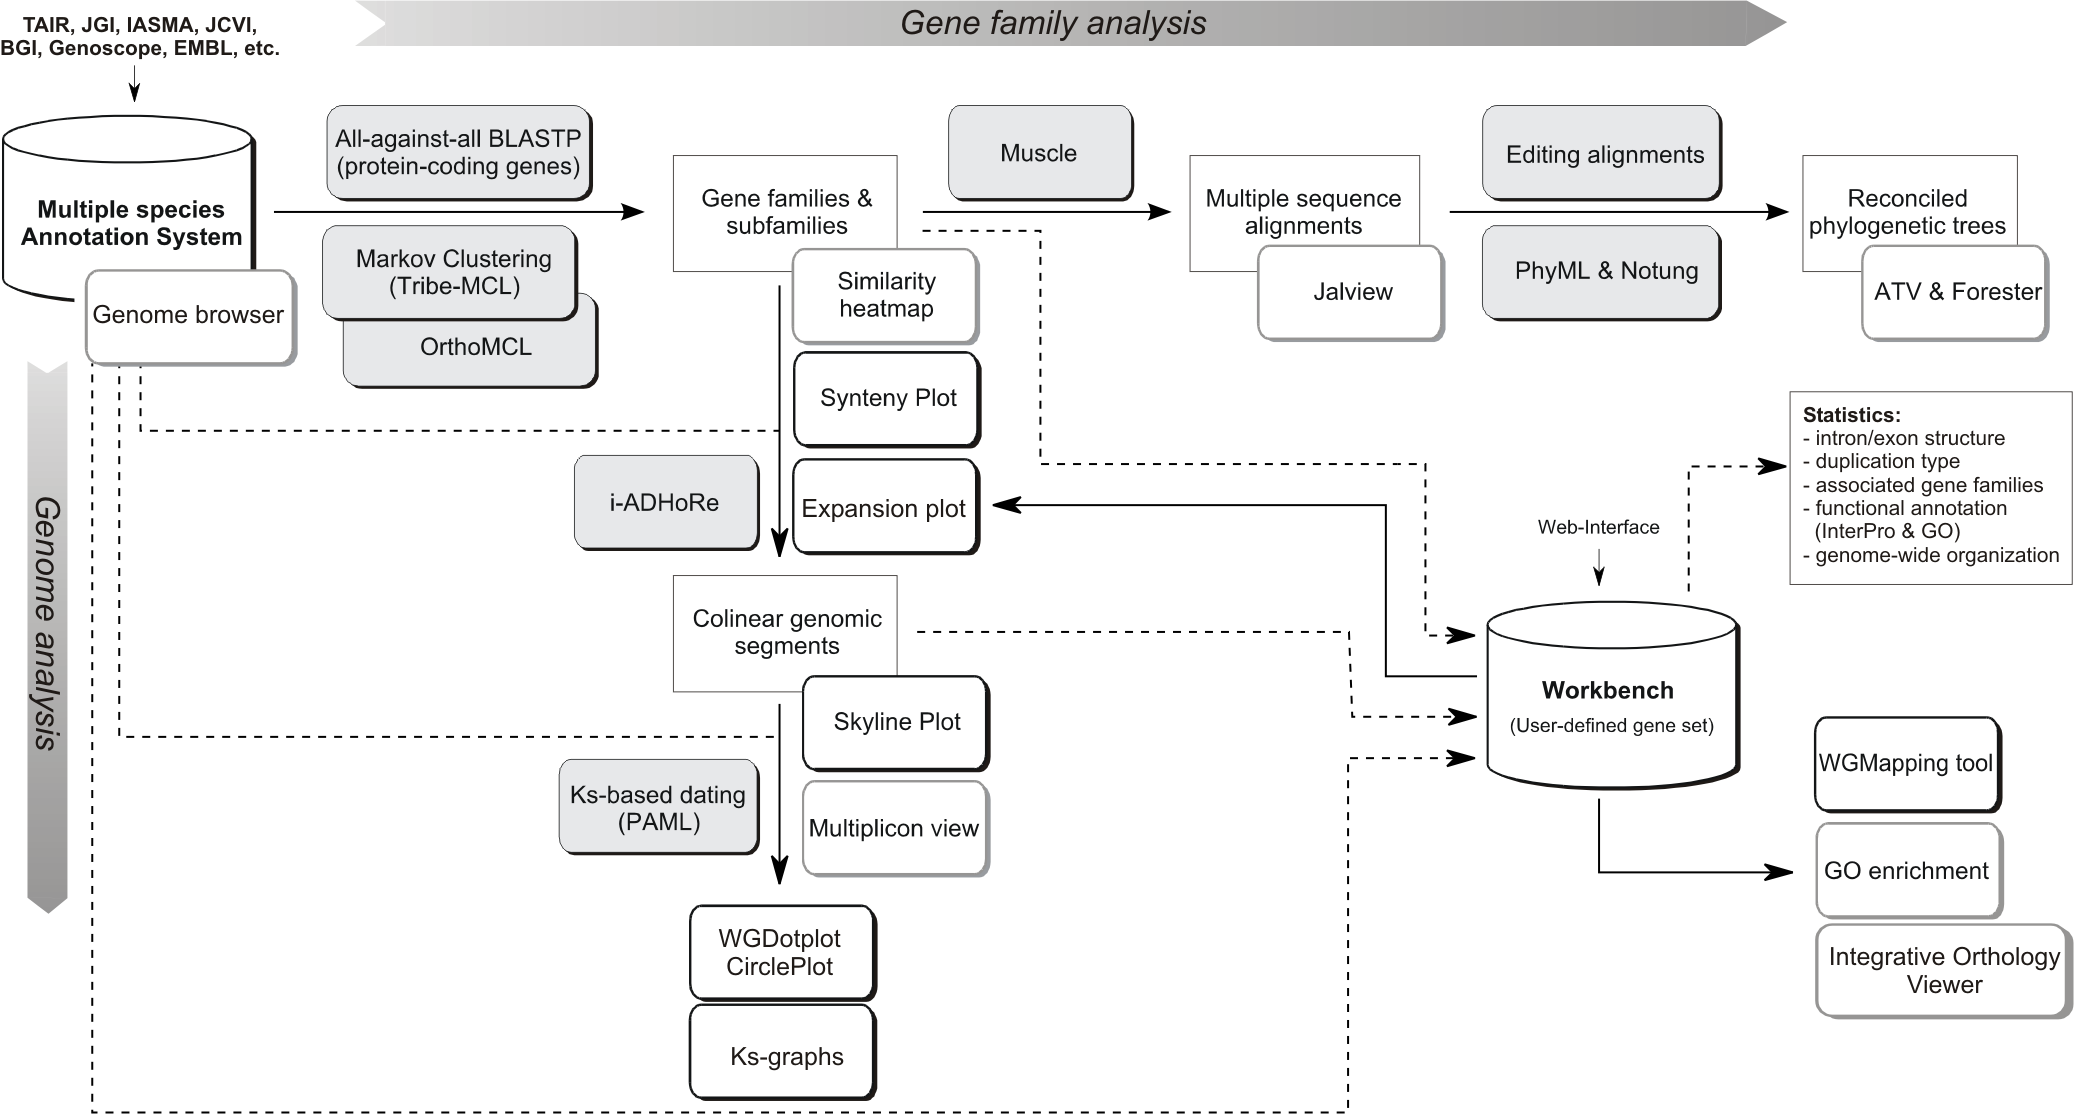
Flowchart of the different steps used to build the PLAZA platform. Grey boxes represent methods & tools whereas white shadowed boxes refer to website visualization tools (most stored under the Analyze menu). A brief description of some essential construction steps is given below while program settings can be found here. For a more detailed explanation, please refer to the PLAZA publications.
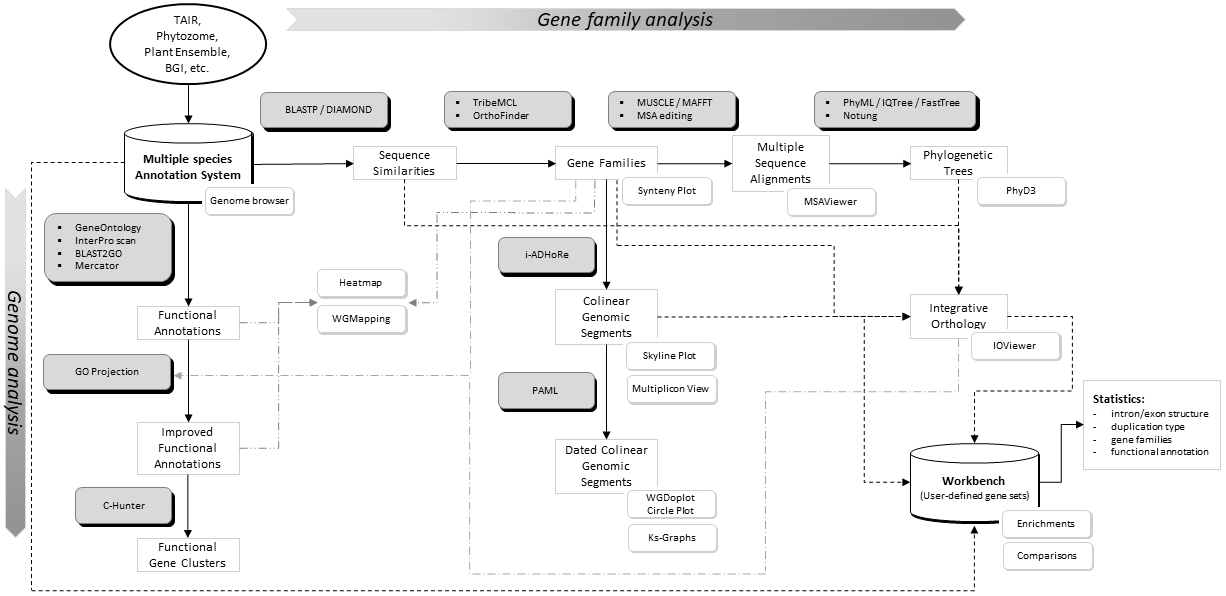
Flowchart of the different steps used to build the PLAZA platform. Grey boxes represent methods & tools whereas white shadowed boxes refer to website visualization tools (most stored under the Analyze menu). A brief description of some essential construction steps is given below while program settings can be found here. For a more detailed explanation, please refer to the PLAZA publications.
Annotation
- Processing gene annotation & alternative splicing: PLAZA uses a simplified annotation based on a 'one locus - one transcript' principle. In case multiple splice variants of a single gene are known only the longest transcript is stored. In the genome browsers (AnnoJ and GenomeView) alternative transcripts can be explored.
- Processing gene annotation & alternative splicing: PLAZA uses a simplified annotation based on a 'one locus - one transcript' principle. In case multiple splice variants of a single gene are known only the longest transcript is stored. In the genome browser (GenomeView) alternative transcripts can be explored.
- Processing gene annotation & alternative splicing: PLAZA uses a simplified annotation based on a 'one locus - one transcript' principle. In case multiple splice variants of a single gene are known only the longest transcript is stored. In the genome browser (IGV.js) alternative transcripts can be explored.
- Erroneous gene models: When parsing all structural gene annotation, we verify if the original gene coordinates do generate the correct transcript and protein sequence (as reported by the primary data provider). Unfortunately, in some cases gene models yield an incorrect transcript (transcript=ne) or protein (protein=ne), sometimes including in-frame stopcodons as well. Consequently, we have chosen to not process these proteins as their inclusion might cause issues further downstream in the PLAZA pipeline. Although these invalid protein sequences are not present in PLAZA's protein database, the corresponding transcript sequences can still be explored using the BLAST page, using BLASTN. Additionally we do provide, if possible, some information about the genes present in PLAZA showing sequence similarity with the corrupt protein sequence (see Comment entry 'Truncated protein similar to').
- Pseudo-chromosomes: Some genomes are not completely assembled into chromosomes and still contain many scaffolds. Genes annotated on these unassigned scaffolds have a gene ID based on their position in an artificial concatenated chromosome 00 (eg. PT00G01010). On the Gene overview page the original scaffold name can be found.
-
GO projection:
- We applied a stringent set of rules to identify, based on the phylogenetic trees, sets of orthologous groups and used GO projection to exchange functional annotation between orthologs. For the GO projection all primary gene annotations Inferred from Electronic Annotation (IEA) were excluded as primary information source. All new gene-GO associations inferred through projection are labeled with evidence tag Inferred from Sequence Orthology (ISO). For newly inferred gene annotations the source gene(s) are stored as well.
- Additional orthologous relationships, used to transfer GO terms, were defined using the PLAZA Integrative Orthology Method.
- GO projection is also performed using much less strict homology definitions. The end-user has the option, through the website, to select/deselect the information collected using GO transfer through sequence-based homology identification.
Gene family evolution
- Protein clustering: All protein-coding genes were used to construct homologous gene families by applying sequence based protein clustering (BLASTP combined with Tribe-MCL (homologous families) & OrthoMCL (sub-families)). The Similarity heatmap tool can be used to view the BLASTP bit-scores between all members in a cluster. This way the quality of the protein clustering can be inspected and can subgroups be detected.
- Protein clustering: All protein-coding genes were used to construct homologous gene families by applying sequence based protein clustering (DIAMOND combined with Tribe-MCL (homologous families) & OrthoFinder (sub-families)). The Similarity heatmap tool can be used to view the BLASTP bit-scores between all members in a cluster. This way the quality of the protein clustering can be inspected and can subgroups be detected.
- Multiple Alignments: For all gene families multiple sequence alignments were created using MUSCLE. Jalview can be started on the website (webstart, no installation is required) to view alignments or export sequence data to your local PC. Jalview also includes some basic tools to create phylogenetic trees.
- Multiple Alignments: For all gene families multiple sequence alignments were created using MUSCLE. MSAViewer can be started on the website to view alignments or export sequence data to your local PC.
- Multiple Alignments: For all gene families multiple sequence alignments were created using MAFFT. MSAViewer can be started on the website to view alignments or export sequence data to your local PC.
- Tree Inference: Phylogenetic trees were constructed using PhyML. Notung 2.6 was used to root the trees and to infer speciation and duplication events using the tree reconciliation mode and applying the Duplication/Loss Score to evaluate alternate hypotheses). Archaeopteryx was used for tree visualization.
- Tree Inference: Phylogenetic trees were constructed using FastTree. Notung 2.6 was used to root the trees and to infer speciation and duplication events using the tree reconciliation mode and applying the Duplication/Loss Score to evaluate alternate hypotheses). Archaeopteryx was used for tree visualization.
- Tree Inference: Phylogenetic trees were constructed using FastTree. Notung 2.6 was used to root the trees and to infer speciation and duplication events using the tree reconciliation mode and applying the Duplication/Loss Score to evaluate alternate hypotheses). PhyD3 was used for tree visualization.
Genome evolution
- Colinearity within and between species was identified using i-ADHoRe. This software package detects genomic homology based on the identification of conservation of gene content and gene order.
- Ks-based dating: PAML was used to date colinear gene pairs based on aligned coding sequences (CLUSTALW). Ks values are used to color multiplicons in the WGDotplot based on their age and a distribution is shown to discriminate multiple duplications. The Ks tool allows a user to compare these distributions of several organisms.
Workbench
- Toolkit included in PLAZA that allows researchers to perform analyses on user-defined gene sets.
- Several types of statistics are determined and stored in the database for fast retrieval. See Tools->Workbench for an overview.
- The GO enrichment tool can be applied to determine over- or under-represented functional annotations.
Tools and parameter settings
- For an overview of all tools and parameter settings used in PLAZA, please visit this page.