Frequently asked questions
- Technical questions
-
Tool questions
- Can you give me some more information about the precalculated experiment sets?
- Why and how to use multiple precalculated expression datasets?
- What kind of annotation data is used?
- What kind of protein-protein interaction data is used?
- What guidelines should I follow when setting the options in Step 3?
- What do all the options in Step 3 mean exactly?
- What is Cytoscape and how do I use it with this tool?
- What do the colors and shapes mean in the networks I see in Cytoscape?
- What kind of input data could be used?
Technical questions
- 1. Why does this site look all messy?
-
That's because you're using Internet Explorer. Don't use it, use Firefox.
To view this site use at least a 1280x1024 resolution and view it in Firefox. - 2. Why does Firefox ask me to cancel the running script?
-
Firefox thinks the script has crashed because it takes so long. But that's normal, it takes a while to load some information from the database.
To fix this problem type in "about:config" in the address bar in Firefox, hit Enter and change the value of dom.max_script_run_time to 60 or higher. - 3. Why is Cytoscape not starting?
- Calculations are done, loading is finished, but Cytoscape does not start. You need to allow pop-ups in your browser. You also need an up to date version of Java (see Tool question 7).
- 4. Why do I have to download Cytoscape every time I launch the Cytoscape view?
- You need to make sure caching is enabled for the Java plugin. You can find out how to enable caching on this page. Make sure the cache size is big enough (50-100 MB).
Tool questions
- 1. Can you give me some more information about the precalculated experiment sets?
-
This Zea mays CORNET version contains two public expression compedia:
- Affymetrix Maize Genome Array Compendium extracted from GEO including unique 128 experiments whereas replicates are summarized calculating the average value (GEO, 12/2010). In total 24 Series (GSE21070, GSE8188, GSE15048, GSE8278, GSE8275, GSE10023, GSE8194, GSE7030, GSE16567, GSE19501, GSE8308, GSE10237, GSE10236, GSE8320, GSE8179, GSE11531, GSE8174, GSE22479, GSE8176, GSE18491, GSE15371, GSE12892, GSE12770, and GSE10243) containing studies of cis-transcriptional variation in different inbred lines, expression profiling of mutants, non-adaptive and imprinted gene expression, different tissues as well as infection with pathogenes were downloaded, combined, and pre-processed using a custom-made CDF file.
- Nimblegen Maize Whole-Genome Microarray 385K (VersionV1_4a.53) taken from Sekhon et al., (2011) including 60 experiments (GEO, 06/2011).
Both compendia contain absolute expression values resulting from the microarray experiment. All possible correlation coefficients are pre-calculated and only those with a corresponding p-value < 0.05 (Bonferroni corrected) are stored into a database for searching (no calculations on the fly). - 2. Why and how to use multiple precalculated expression datasets?
-
The correlation coefficient for two genes can vary considerably depending on the input expression dataset.
- By selecting multiple expression datasets, co-expression in different conditions can be studied simultaneously. The expression datasets that can be selected are described in Question 1.
- Co-expression links are reported when they meet the requirements set in step 3 (Pearson correlation coefficient threshold, top most correlated genes, or both (see Question 5)). One can report only those co-expression links that meet the requirements based on all selected expression datasets or at least X expression datasets.
- The correlation coefficients found in the different datasets will be reported in the "dataset coefficients" attribute (see Question 7). On the edges, either the minimum, maximum or average correlation coefficient ("corrcoeff" attribute) over the datasets meeting the requirements will be shown.
- 3. What kind of annotation data is used?
-
Both experimentally identified and predicted localizations are used. The source of the data and according evidence code is
mentioned in the Cytoscape attributes.
Data type Data source Download date cellular_component (GO) MaizeSequence.Org 2010-07-21 biological_process (GO) MaizeSequence.Org 2010-07-21 molecular_function (GO) MaizeSequence.Org 2010-07-21 INTERPRO_domain MaizeSequence.Org 2010-07-21 pathways MapMan 2010-02-12 - 4. What kind of protein-protein interaction data is used?
-
The data are transfered from the species Arabidopsis thaliana via homology studies using
OrthoMCL results from PLAZA
v2 framework. Both
experimentally identified and predicted protein-protein interactions are used. The source of the data is
mentioned in the Cytoscape attributes.
Data type Data source Download date protein-protein_interaction ArathReactome 2011-09-29 protein-protein_interaction AtPID 2011-09-20 protein-protein_interaction BioGRID 2011-09-01 protein-protein_interaction Geisler-Lee et al., 2007 (BAR, Arabidopsis Interactions Viewer) 2007-08-03 protein-protein_interaction IntAct 2011-09-14 protein-protein_interaction TAIR 2011-09-15 protein-protein_interaction De Bodt et al., 2009 (filtered and predicted) 2008-12-09 protein-protein_interaction DIP 2010-10-10 protein-protein_interaction MINT 2011-07-08 protein-protein_interaction Arabidopsis Interactome Mapping Consortium - Yeast-2-hybrid 2011-08-01
- 5. What guidelines should I follow when setting the options in Step 3?
-
- Start with stringent parameters depending on the number of query genes:
- High correlation coefficient (e.g. 0.8)
- Low number of neighbours (e.g. 10)
- Gradually loosen the stringency of the parameters
- When the co-expression network is too large, a warning will be given. A text output instead of a visual Cytoscape output can be chosen
- Start with stringent parameters depending on the number of query genes:
- 6. What do all the options in Step 3 mean exactly?
-
Pairwise comparisons:
All possible combinations between query genes are made. A correlation coefficient is calculated for each pair of genes
Neighbours:
Add extra genes. Every query gene is compared to the complete Arabidopsis genome. A gene pair with a correlation coefficient above the chosen thresholds or a gene belonging to the top X most correlated genes is reported.
Thresholds:
Two thresholds can be chosen.- Correlation coefficients higher and lower than a certain value (if given) are reported.
- The top X genes with highest correlation coefficients are reported.
- When using multiple datasets, the same approach is followed for each expression dataset and results are combined or intersected based on the "atleast" parameter. For example, if atleast=2 is chosen, only co-expression links meeting the requirements for two or more datasets are reported.
(e.g. If you ask for top 10 neighbours but only 6 meet the first threshold's requirement, only 6 are shown. If you ask for top 10 neighbours but many more meet the first threshold's requirement, only 10 are shown.)
Relations between neighbours:
If you want to test if the neighbours of your query gene are co-expressed, you need to choose this option. - 7. What is Cytoscape and how do I use it with this tool?
-
Cytoscape is an open source bioinformatics software platform for visualizing molecular interaction networks and integrating these interactions with gene expression profiles and other state data.
Cytoscape will launch through JAVA™ Web Start Launcher
You may need to update JAVA™ for the Cytoscape Web Start.
Get the latest JAVA™ Runtime Environment
You can also download and install the latest version of Cytoscape locally on your computer.
To view more information about an edge or a node, click on the "Select attributes" button in the Data Panel.
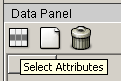
Then select all the desired columns you want to be visible.
This table is an overview of the available attributes:Node attributes ID GRMZM code description GRMZM code (and alias, if available) descriptionLong short MaizeSequence.Org functional description gene.selected indicates in which step of the application this gene was a query gene localization localization of a gene derived from the GO cellular component information and used for the visualization within the network (see legend) localizationReferences references and evidence codes of the localization of the gene
Hint: Move your mouse over this column and wait for the tooltip to appear. The tooltip is nicely formatted HTML and easier to read.biologicalProcess GO biological process molecularFunction GO molecular function cellularComponent GO cellular component proteinDomains InterPro protein domains link:db identifiers for knowledge search in external databases, e.g. db = {KEGG, KOG, PLAZAv2, Panther, Pfam, EntrezGene, GenBank,
RefSeq, UniGene, UniProt, Enzyme}
Note, some of the identifiers are based on orthologous gene information!athOrtholog orthologous information for Arabidopsis osaOrtholog orthologous information for rice zmbOrtholog orthologous information for maize athDescOrthologs short TAIR functional description of the orthologous Arabidopsis genes MapMan MapMan pathway information Edge attributes ID label describing the relation between 2 genes: (cor) = correlation, (pp) = protein-protein interaction interaction kind of relation between genes corrcoeff The correlation value [-1.0,1.0] between 2 genes if the edge indicates a correlation n_ref how many times this protein-protein interaction is referenced features detailed information about the references and the orthologous relationship which was used to predict this protein-protein interaction
Hint: Move your mouse over this column and wait for the tooltip to appear. The tooltip is nicely formatted HTML and easier to read.prop indicates if the protein-protein interaction is experimental or predicted dataset coefficients individual coefficients for the selected datasets dataset pvalues individual p-values for the selected datasets matching datasets number of datasets returning a correlation coefficient matching the selected criteria - 8. What do the colors and shapes mean in the networks in Cytoscape?
-
Visualization legend:
Correlation networks Edge color 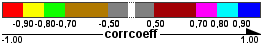
Query gene 
Protein-protein interactions Edge color black Edge width the more references, the wider the edge Edge style = experimental
= predictedQuery gene 
COR and PPI Query gene 
 Localization pie colors
(the size of a pie slice represents how much
a value is referenced compared to the others)CYTOSKELETON PEROXISOME OTHER CELLPLATE NUCLEOLUS CYTOSOL CHLOROPLAST NUCLEUS MITOCHONDRIA ENDOSOME PLASTID VACUOLE ENDOPLASMICRETICULUM EXTRACELLULAR PLASMAMEMBRANE GOLGI
- 9. What kind of input data could be used?
-
By default the input data are GRMZM codes of your genes of interest. Other maize identifiers, such as PLAZA v2.0 identifiers (e.g. ZM08G15930),
Affymetrix probe identifiers (e.g. ZM.17362.s1_at), or Maize Oligonucleotide Array identifiers (e.g. MZ00002380 from Arizona Maize Array) are also accepted as input.
Additionally, the program allows also orthologous gene identifiers from Arabidopsis using the AGI code (TAIR
identifiers, e.g. At2g33610), orthologous gene locus identifiers from rice (TIGR identifiers without the LOC_ prefix, e.g. Os02g10060).
Note that, if an orthologous gene (from Arabidopsis and/ or Oryza) is given and if it is part of a group of orthologous genes with a many-to-many relationship (extracted using OrthoMCL results from PLAZA v2 framework) then from this orthologous group all maize genes will taken into account.