Frequently asked questions
- Technical questions
-
Tool questions
- Can you give me some more information about the precalculated experiment sets?
- Why and how to use multiple precalculated expression datasets?
- What kind of localization data is used?
- What kind of functional annotation data is used?
- What kind of protein-protein interaction data is used?
- What kind of regulatory interaction data is used?
- What guidelines should I follow when setting the options in Step 3?
- What do all the options in Step 3 mean exactly?
- What is Cytoscape and how do I use it with this tool?
- What do the colors and shapes mean in the networks I see in Cytoscape?
- How can I compile a user-defined dataset of microarray experiments?
- How do I use my own microarray data with this tool?
- Where can I download the raw microarray data (CEL files)?
Technical questions
- 1. Why does this site look all messy?
-
That's because you're using Internet Explorer. Don't use it, use Firefox.
To view this site use at least a 1280x1024 resolution and view it in Firefox. - 2. Why does Firefox ask me to cancel the running script?
-
Firefox thinks the script has crashed because it takes so long. But that's normal, it takes a while to load the ontologies.
To fix this problem type in "about:config" in the address bar in Firefox, hit Enter and change the value of dom.max_script_run_time to 60 or higher. - 3. Why is Cytoscape not starting?
- Calculations are done, loading is finished, but Cytoscape does not start. You need to allow pop-ups in your browser. You also need an up to date version of Java (see Tool question 7).
- 4. Why do I have to download Cytoscape every time I launch the Cytoscape view?
- You need to make sure caching is enabled for the Java plugin. You can find out how to enable caching on this page. Make sure the cache size is big enough (50-100 MB).
Tool questions
- 1. Can you give me some more information about the precalculated experiment sets?
-
The precalculated expression compendia contain absolute expression values resulting from the preprocessing
of the microarray data.
Preprocessing: RMA procedure (background correction, normalization, summarization - note that this procedure returns log2 transformed expression values)
The TAIR10 - v14 CDF (Chip Description File) downloaded from Brainarray was used to map probes to genes.
AtGenExpress All (425 experiments)
All experiments performed by AtGenExpress
Microarray compendium 1 (454 experiments)
Collection of microarray experiments oriented towards growth, development and cell cycle studies
Microarray compendium 2 (192 experiments)
Collection of microarray experiments. Very similar experiments were removed. Similar numbers of experiments of each design type
Abiotic stress (256 exp)
Abiotic stress series (cold, drought, genotoxic, heat, osmotic, oxidative, salt, UV-B, wounding)
Biotic stress (69 exp)
Biotic stress series (Botrytis, Pseudomonas, Phytophtora, etc.)
Development (135 exp)
Developmental series (different tissues, developmental stages, developmental mutants)
Flower (72 exp)
Microarray experiments in which floral tissues are sampled
Genetic modification (313 exp)
Microarray experiments in which transgenic lines are profiled (gene overexpression (knock-in), gene knock-out, transient transgene expression)
Hormone treatment (140 exp)
Hormone treatment series (ABA, brassinosteroids, GA, cytokinin, etc. and inhibitors)
Leaf (212 exp)
Microarray experiments in which leaf tissues are sampled
Root (258 exp)
Microarray experiments in which root tissues are sampled
Seed (83 exp)
Microarray experiments in which seed tissues are sampled
Stress (abiotic+biotic) (336 exp)
Combination of the abiotic and biotic stress dataset
Whole plant (85 exp)
Microarray experiments in which whole plants are sampled
DIFFERENT DESIGN TYPES: Different MO terms were added to describe the type of experiment performed.
- stimulus_or_stress_design
- abiotic_stress_design
- biotic_stress_design
- compound_treatment_design
- hormone_treatment_design
- genetic_modification_design
- growth_condition_design
- time_series_design
- circadian_rhythm_design
- development_or_differentiation_design
- individual_genetic_characteristics_design
- organism_part_comparison_design
- strain_or_line_design
- translational_bias_design
- stimulus_or_stress_design
- 2. Why and how to use multiple precalculated expression datasets?
-
The correlation coefficient for two genes can vary considerably depending on the input expression dataset.
- By selecting multiple expression datasets, co-expression in different conditions can be studied simultaneously. The expression datasets that can be selected are described in Question 1.
- Co-expression links are reported when they meet the requirements set in step 3 (Pearson correlation coefficient threshold, top most correlated genes, or both (see Question 5)). One can report only those co-expression links that meet the requirements based on all selected expression datasets or at least X expression datasets.
- The correlation coefficients found in the different datasets will be reported in the "dataset coefficients" attribute (see Question 7). On the edges, either the minimum, maximum or average correlation coefficient ("corrcoeff" attribute) over the datasets meeting the requirements will be shown.
- 3. What kind of localization data is used?
-
Both experimentally identified and predicted localizations are used. The source of the data and according evidence code is
mentioned in the Cytoscape attributes.
Data type Data source Download date localization SUBA 2009-06-05 localization IPSort 2007-11-25 localization LocTree 2007-11-25 localization MitoProt 2007-11-25 localization MultiLoc 2007-11-25 localization PeroxP 2007-11-25 localization Predator 2007-11-25 localization SubLoc 2007-11-25 localization SwissProt 2007-11-25 localization TargetP 2007-11-25 localization WoLF_PSORT 2007-11-25 - 4. What kind of functional annotation data is used?
-
Diverse resources for functional gene annotation are integrated. The source of the data and according evidence code, the
number of databases and the type of data are mentioned in the Cytoscape attributes and can be viewed in the Cytoscape
Attribute Browser (Lower panel) (See Tool question 9).
Data type Data source Download date biological_process (GO) TAIR 2010-08-21 molecular_function (GO) TAIR 2010-08-21 INTERPRO_domain TAIR 2008-12-17 PubMed ID TAIR 2011-04-01 Phenotype TAIR 2011-05-24 MapMan pathways and processes MapMan 2011-06-17 - 5. What kind of protein-protein interaction data is used?
-
Both experimentally identified and predicted protein-protein interactions are used. The source of the data is
mentioned in the Cytoscape attributes. Note that the AraNet gene-gene association data are also represented as
protein-protein interactions. However, these interactions are not necessarily direct interactions. MIND0.5 contains the
results of a binary split ubiquitin interaction screen of membrane proteins and proteins curated as signaling proteins.
These data need independent verification (see MIND
database).
Data type Data source Download date protein-protein_interaction ArathReactome 2009-10-12 protein-protein_interaction AtPID 2007-12-10 protein-protein_interaction BioGRID 2010-07-26 protein-protein_interaction De Bodt et al., 2009 (filtered) 2008-12-09 protein-protein_interaction De Bodt et al., 2009 (predicted) 2008-12-09 protein-protein_interaction DIP 2010-06-14 protein-protein_interaction Geisler-Lee et al., 2007 (BAR Arabidopsis Interactions Viewer) 2007-08-03 protein-protein_interaction IntAct 2010-08-10 protein-protein_interaction MINT 2010-07-27 protein-protein_interaction TAIR 2009-05-27 protein-protein_interaction MIND0.5 (www.associomics.org) 2011-08-01 protein-protein_interaction Arabidopsis Interactome Mapping Consortium - Yeast-2-hybrid 2011-08-01 protein-protein_interaction EVEX text mining data - binding 2012-05-02 gene-gene_association AraNet (www.functionalnet.org/aranet) 2011-06-21
- 6. What kind of regulatory interaction data is used?
-
- Regulatory interactions are retrieved from AGRIS, consisting of interactions identified through ChIP-chip, ChIP-Seq, yeast one-hybrid, EMSA, microarray analysis, ChIP-PCR, RT-PCR.
- Interactions can be confirmed (solid edges) or unconfirmed (dashed edges) and direct (arrow) or indirect (circle as arrow head).
- In addition, regulatory interactions are inferred from the CORNET microarray data with genetic_modification as design type (see Tool question 1). In these experiments, transcript profiling of transgenic lines in which one or more genes (either encoding for a transcription factor or not) is overexpressed or mutated. Differentially expressed genes are identified using Limma (BioConductor), comparing transgenic to wild type plants.
- Finally, direct and indirect regulatory interactions are retrieved from the EVEX text mining resource.
- Regulatory interactions inferred from microarray data are assumed to be unconfirmed (dashed edges) and indirect (circle as arrow head) in the Cytoscape attributes.
- If known, it is indicated if the target gene is either activated (green arrow head) or repressed (red arrow head) in the particular regulatory interaction. See legend in Tool question 10.
- In case more than 1 gene is found to regulate it's targets as a complex, the pairwise interactions between these genes are indicated by the "dimer" edge.
- 7. What guidelines should I follow when setting the options in Step 3?
-
- Start with stringent parameters depending on the number of query genes:
- High correlation coefficient (e.g. 0.8)
- Low number of neighbours (e.g. 10)
- Gradually loosen the stringency of the parameters
- When the co-expression network is too large, a warning will be given. A text output instead of a visual Cytoscape output can be chosen
- Start with stringent parameters depending on the number of query genes:
- 8. What do all the options in Step 3 mean exactly?
-
Pairwise comparisons:
All possible combinations between query genes are made. A correlation coefficient is calculated for each pair of genes
Neighbours:
Add extra genes. Every query gene is compared to the complete Arabidopsis genome. A gene pair with a correlation coefficient above the chosen thresholds or a gene belonging to the top X most correlated genes is reported.
Thresholds:
Two thresholds can be chosen.- Correlation coefficients higher and lower than a certain value (if given) are reported.
- The top X genes with highest correlation coefficients are reported.
- When using multiple datasets, the same approach is followed for each expression dataset and results are combined or intersected based on the "atleast" parameter. For example, if atleast=2 is chosen, only co-expression links meeting the requirements for two or more datasets are reported.
(e.g. If you ask for top 10 neighbours but only 6 meet the first threshold's requirement, only 6 are shown. If you ask for top 10 neighbours but many more meet the first threshold's requirement, only 10 are shown.)
Relations between neighbours:
If you want to test if the neighbours of your query gene are co-expressed, you need to choose this option. - 9. What is Cytoscape and how do I use it with this tool?
-
Cytoscape is an open source bioinformatics software platform for visualizing molecular interaction networks and integrating these interactions with gene expression profiles and other state data.
Cytoscape will launch through JAVA™ Web Start Launcher
You may need to update JAVA™ for the Cytoscape Web Start.
Get the latest JAVA™ Runtime Environment
You can also download and install the latest version of Cytoscape locally on your computer.
To view more information about an edge or a node, click on the "Select attributes" button in the Data Panel.
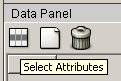
Then select all the desired columns you want to be visible.
This table is an overview of the available attributes:Node attributes ID agi code description short TAIR functional description descriptionLong verbose TAIR functional description gene.selected indicates in which step of the application this gene was a query gene localization localization of the gene localizationReferences references and evidence codes of the localization of the gene
Hint: Move your mouse over this column and wait for the tooltip to appear. The tooltip is nicely formatted HTML and easier to read.biologicalProcess GO biological process molecularFunction GO molecular function proteinDomains InterPro protein domains MapMan MapMan pathways and processes PMID PubMed ID assigned to a certain gene by TAIR Phenotype Phenotype assigned to a transgenic line of a certain gene by TAIR Edge attributes ID label describing the relation between 2 genes: (cor) = correlation, (pp) = protein-protein interaction, (tf) = regulatory interaction interaction kind of relation between genes, e.g. regulatory interactions (activation or repression, direct or indirect) corrcoeff The correlation value [-1.0,1.0] between 2 genes if the edge indicates a correlation n_ref how many times this protein-protein interaction is referenced features detailed information about the references
Hint: Move your mouse over this column and wait for the tooltip to appear. The tooltip is nicely formatted HTML and easier to read.prop indicates if the protein-protein interaction is experimental or predicted dataset coefficients individual coefficients for each dataset, if the coefficient is situated between -0.6 and 0.6, NA (not available) is returned matching datasets number of datasets returning a correlation coefficient matching the selected criteria PPI_evidence additional evidence from the original data source (AraNet and MIND0.5) evexconf EVEX confidence values evexeventid EVEX event ids which can be used to link out to the original EVEX database (right-click in attributes table > Search on web > Plants_Arabidopsis) evexevi indicates whether an event is speculated and/or negated evexreg specifies the type of regulation (e.g. regulation of expression) - 10. What do the colors and shapes mean in the networks in Cytoscape?
-
Visualization legend:
Correlation networks Edge color 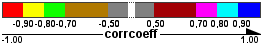
Query gene 
Protein-protein interactions Edge color black Edge width the more references, the wider the edge Edge style  = experimental
 = predicted
Query gene 
Transcription factor interactions Edge color black Edge width the more references, the wider the edge Edge style = Confirmed = Unconfirmed
 Edge arrow  = direct + Activation
 = direct + Repression
  =
direct + unknown
=
direct + unknown
 = indirect
 Arrow color green = activation
red = repression
black = unknownQuery gene 
COR and PPI Query gene 
COR and TF Query gene 
TF and PPI Query gene 
 Localization pie colors
(the size of a pie slice represents how much
a value is referenced compared to the others)CYTOSKELETON PEROXISOME OTHER CELLPLATE NUCLEOLUS CYTOSOL CHLOROPLAST NUCLEUS MITOCHONDRIA ENDOSOME PLASTID VACUOLE ENDOPLASMICRETICULUM EXTRACELLULAR PLASMAMEMBRANE GOLGI - 11. How can I compile a user-defined dataset of microarray experiments?
-
There are 2 ways to do this (you will be the only user able to view this dataset):
- Via the Co-expression tool -> User-defined page
- Search for the desired experiments by choosing keywords.
- Hit the "Fetch Experiments!" button.
- Select the experiments you actually want to use.
- Give your set of experiments a name. (This name must be unique per user.)
- Click the "Normalize" button.
- After normalization is finished, you'll see a link you have to click to continue. Click it.
- This brings you to the Co-expression tool -> Predefined page, but with your dataset already selected. (You can still save the data locally by clicking the Save icon next to it.)
- Via the Browse experiments page
- Search for the desired experiments by choosing keywords.
- Hit the "Fetch Experiments!" button.
- Select the experiments you actually want to use.
- Click the "Normalize" button.
- After normalization is finished, you'll see a link to a file. Download the file.
-
You will receive a zipped file starting with norm_ followed by a random alphanumeric string.
In this file, you'll find two text files:- rma_randomString.txt: contains the normalized rma data
The first line of this file is a comment line containing the experiment name per column. - desc_randomString.txt: contains the description of the experiments mentioned in the rma file.
This file is formatted as a tab delimited file. The first line contains the column headers and each row shows the information for one experiment.
- rma_randomString.txt: contains the normalized rma data
- You can use these files as input on the Co-expression tool -> Predefined page now, using the Upload own rma data option.
- Via the Co-expression tool -> User-defined page
- 12. How do I use my own microarray data with this tool?
-
- I have raw data (CEL files):
- Go to the Upload page (You can edit previously uploaded experiments by going to the Edit page)
- Fill in the form
- Your experiment is now available to you through Browse experiments.
Use them as explained in How can I compile a user-defined dataset of microarray experiments?. - Your experiments are indicated by
 , public ones by
  For more details, download the tutorial.
- I have normalized data (rma file):
- Go to the Co-expression tool -> Predefined page
- Choose the "Upload your own data" option in Step 2
- Browse to your normalized data file
This file should meet the following requirements:- The first line is a header line with experiment names. For each column, there should be a name in the header. These names should be seperated by tabs.
- The first character on the header line should be a #, followed by a tab.
- The first column should contain the gene IDs (AGI codes).
- Each row represents the expression values of one gene over all experiments, seperated by tabs.
- I have raw data (CEL files):
- 13. Where can I download raw microarray data (CEL files)?
-
- Go to the Browse experiments page.
- Fetch the experiments you want by choosing keywords.
- Select the experiments you actually want to download from the list of fetched experiments.
- Hit the "Download raw data" button. !!! WHEN DOWNLOADING A LARGE AMOUNT OF DATA IT IS NORMAL THAT THE PAGE TAKES A WHILE TO LOAD !!!
- The file you download contains all the CEL files and a text file called input_<randomString>.txt.
This text file can be used as input for an R script for example.
It also contains a file called desc_<randomString>.txt which contains the descriptions of the experiments.