Comparative Co-Expression Network Construction and Visualization
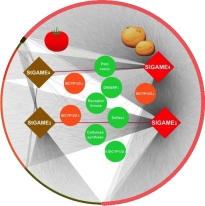
CoExpNetViz takes as input a set of bait genes chosen by you and at least one pre-processed gene expression dataset. You can also specify a negative and positive cutoff value, which will be used to determine if two genes are co-expressed or not.
In short the algorithm proceeds in three big steps:
- The co-expression dataset is translated into a co-expression graph using the Pearson correlation coefficient and the cutoff values.
- Non-bait genes (or target genes) are grouped together in homologous families, which results in a graph with two types of nodes: bait genes nodes and family nodes.
- The family nodes are grouped into partitions if the target genes they contain are co-expressed with the same set of bait genes. The output of the algorithm is visualized in Cytoscape.
Tzfadia, O., Diels, T., De Meyer, S., Vandepoele, K., Aharoni, A., & Van de Peer, Y. (2016). CoExpNetViz: comparative co-expression networks construction and visualization tool. FRONTIERS IN PLANT SCIENCE, 6.
